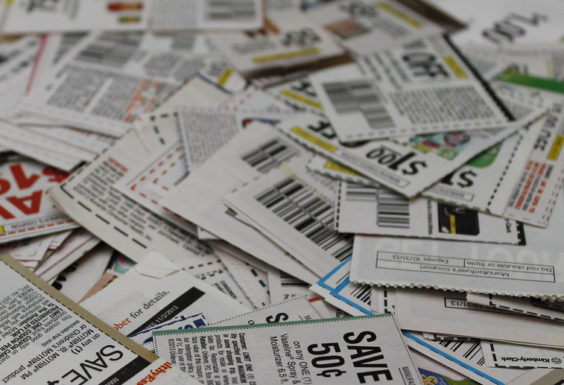
There aren’t many coupon inserts left to come in 2014, with both SmartSource and RedPlum taking three of the year’s remaining five weeks off. But according to newly-released coupon statistics, it’s been a pretty good year already – in fact, by one important measure, it’s shaping up to the best ever.
Inmar, which issues in-depth reports on coupon trends each year, has released a bit of a preview of what its year-end 2014 report might look like.
The good news is that coupons are getting much more valuable – more valuable than ever before, in fact. Year-to-date, the average face value of food coupons is $1.15, and non-food is $2.05. If those numbers hold up through the end of the year, it will be the first time the non-food average has surpassed the two-dollar mark. And the average face value of food coupons will just edge out 2011 as the best ever.
Of course, with grocery prices on the rise, it is to be expected that coupon values will rise accordingly. And when you add it all up, that doesn’t necessarily mean greater savings.
Inmar says 251 billion coupons were distributed through the end of the third quarter of the year, down 1.7% compared to the same period last year. Overall redemption of 2.14 billion was down as well, by 2.5%.
So, coupons are getting more valuable, but there are fewer of them, and we’re redeeming fewer still. Could it be that high values alone aren’t enough to entice us to use all of these hundreds of billions of coupons?
One contributing factor that’s been noted in recent years, and appears to be continuing, is shorter redemption periods. Both food and non-food coupons’ average expiration dates are down to 2.4 months and 1.9 months, respectively.
Meantime, in a surprising setback, it appears that digital coupons – which have long enjoyed unprecedented growth – might be losing a bit of steam.
Inmar says redemption of paperless digital coupons has more than doubled since last year. An estimated 650 million digital coupons were “clipped” in the first nine months of the year, which is a lot. But that figure is on pace to be lower than last year’s, when digital coupon clips first surpassed one billion.
And for the first time, it appears that printable coupons are falling below digital coupons in terms of popularity. Compared to digital coupons’ 650 million clips, Inmar estimates that 600 million printable coupons were printed in the first three quarters of the year. The average redemption rate so far is 11%, well below 2013’s year-end rate of 17%.
A late surge in the last quarter of the year could always boost the numbers to 2013 levels, or beyond. So Inmar remains bullish on digital coupons. As well it should be, since it’s in the business of providing and processing billions of them each year. And it just recently acquired the printable coupon company Hopster, which it promised would enable the launch of the “next generation of digital coupon promotions”.
“Shoppers want convenience when it comes to finding ways to save and their surging use of load-to-card coupons shows us that,” Inmar Chairman and CEO David Mounts said in a statement announcing the third-quarter statistics. “The increasing capability of marketers to personalize and target these paperless offers is only going to grow their popularity among shoppers.”
Ultimately, it’s worth noting that good old-fashioned coupons from the Sunday newspaper inserts still represent the lion’s share of all coupons out there. The inserts provided 228 billion, or 91%, of all coupons issued so far this year. And they represented 41%, or 873 million, or all coupons redeemed. Digital coupons’ share is way down in the low single digits.
Digital coupons’ time will come, soon enough. But in the meantime – you might not want to cancel your Sunday newspaper subscription just yet.


The average face value of coupons may have risen to $1.15, but that doesn’t tell the whole story. It seems to me that most coupons now require multiple purchases, e.g. $1/2 items or $2/2 items. For comparison’s sake, they really should compare the amount off per item in addition to the face value of the coupon. The multiple purchase requirements probably have affected the redemption rates as well.
You’re absolutely right, Lisa! This third-quarter report didn’t get into as much detail as their year-end reports, but the 2013 report divided the values into face value per coupon vs. face value per item (for coupons that require multiple purchases).
They found that the average face value for food coupons was $1.03, but it went way down to a $0.77 average per item. Non-food’s average was $1.92, but per item was $1.70.
So with multiple purchase requirements and shorter expiration dates, face values alone definitely don’t tell the whole story…