Previewing each week’s Sunday coupon inserts is an imperfect science. Depending on where you live, you may be disappointed that you don’t get all of the coupons in the previews that are published here and elsewhere around the web. Or, you might be pleasantly surprised that you get more than you expected.
It all depends on where you live, and how valuable you’re considered to the companies that issue the coupons.
Now, comparing and combining two new maps and sets of statistics, reveals which cities have the best coupons in the country. Is yours one of them?
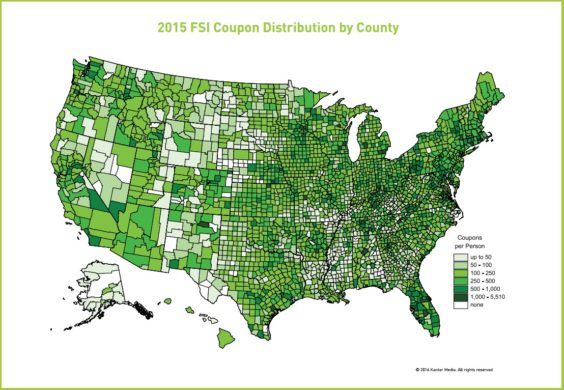
The first map, pictured above (click to enlarge), comes from Kantar Media’s 2015 Free Standing Insert Distribution Trends report. Kantar’s annual report found that 286 billion coupons were distributed via Sunday newspaper inserts last year. The map shows how those coupons were distributed across the country.
It is perhaps no surprise that big-city newspapers tend to get the best coupon inserts. Smaller towns, with smaller populations, get thinner inserts with fewer and less valuable offers inside. Kantar’s map quantifies this, by showing the number of coupons distributed per county, per capita. The counties colored in the lightest shade of green received anywhere from zero to 50 coupons per resident last year. The darkest green-colored counties received between 1,000 and 5,510 per person.
While intriguing, the per-capita map doesn’t tell the whole story, since it doesn’t reflect the raw numbers of just how many coupons were distributed in each county. Sparsely-populated Jefferson County, Nebraska, for example, is a darker shade of green than New York and Los Angeles. But it doesn’t necessarily mean that Nebraska is a gold mine for coupons, compared to the largest cities in the country – it just means that the supply of available coupons is greater for each of Jefferson County’s 7,570 residents, than for the millions of New Yorkers and Los Angelenos.
So a corresponding Coupons in the News analysis identified the dollar values of coupon inserts across the country. More than a hundred newspapers promote the total value of their inserts, right on their front pages – “$200 in coupons inside!” Many don’t, but enough do that you can get a rough idea of whose coupons are better than others’.
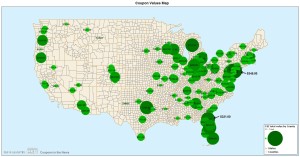
The map below (click to enlarge) plots the total value of coupons across the country last Sunday, February 7th, when there were both SmartSource and RedPlum inserts. The larger and darker the circle, the greater the total value of the coupons. Several cities aren’t included, either because their newspapers didn’t publish the total value of their coupons, or they inflated the value by including retailer offers in department store circulars and other non-grocery inserts (despite what New York’s Albany Times Union promised, you were not going to find $3,382 worth of grocery coupons inside last Sunday’s edition).
But you can get a good sense of where to go, to get the best grocery coupons. Not Billings, Montana, where the Billings Gazette had a mere $38 in coupons to offer. The Lubbock Avalanche-Journal in Texas didn’t do much better, with just $40. But the Philadelphia Inquirer topped them all, with $345 in coupons available.
The dollar values alone don’t tell the whole story either, since high-value coupons don’t do much good if there aren’t enough inserts to go around for everyone who wants them. The Dallas Morning News, for example, offered $306 in coupons, but Dallas County is colored a medium shade of green on Kantar’s map, which means it offers far fewer coupons per capita than other cities. So don’t go rushing off to Dallas for some great coupons, because there may not be any when you get there. Alabama’s Jefferson County is the darkest shade of green, yet the Birmingham News offered just $141 in coupons.
So cross-referencing the two maps, combining coupon values and coupons per capita, leads to an unofficial declaration of which cities have the best coupons in the country. And this year’s winners are Philadelphia, Pennsylvania; Jacksonville, Florida; Detroit, Michigan and Orlando, Florida.
Orlando is a repeat winner after sharing that title last year with Minneapolis, Pittsburgh and Atlanta, all of which still fared pretty well this year. But Detroit? The Detroit Free Press had $281 in coupons, and it’s the darkest shade of green on Kantar’s map this year, which is enough to vault it into the top tier.
So if you live in one of the winning cities, consider yourself fortunate – you have the best, highest value and the most available coupons in the country. If you live someplace where the coupons are lacking, you might consider a road trip. If you don’t mind subfreezing temperatures and lots of snow, we hear Detroit is pretty nice this time of year. Its coupons certainly are.


the Dothan Eagle stinks when it comes to coupons we only have maybe ten coupons been thinking about not buying the paper I could use that money to buy ink etc. this is Dothan Ala unhappy
I get both our towns papers too for the variety. There’s a big difference between the Rockford register star & the Chicago tribune. The Chicago coupons r awesme!
It’s interesting, I just did an inventory of last Sunday’s coupons from my paper comparing what was printed on the paper cover, and the paper under-reported to total value (I factored value of B1G1’s which they may not have). That said, $30 of coupon value is attributed to a $10 and a $20 coupon for hair regrowth product that I’m not sure is of much value to 95% of the population.
Also, the product coupons from a bigger city newspaper have more value to some of us than some we received exclusively in our mid-size insert (i.e. we didn’t get the Arrowhead, Hersheys, Playtex and several other ‘hot’ coupons). I usually end up buying both papers for the variety.
The Los Angeles Times gets many more coupons at higher values than the San Diego Union Tribune (both now co-owned). In Orange County, the Los Angeles Times also has many more coupons with mostly better values than the Orange County Register. In Los Angeles County, there are multiple newspapers. The Los Angeles Times gets the lions share of coupons – every Sunday a minimum of 2 SS sections even when there is 1 nationally. LANG owns most of the suburban Los Angels County newspapers, many of which overlap in circulation, but their Los Angeles Daily News, Torrance Daily Breeze and Long Beach Press-Telegram, for example, have minimal coupons vs. the Los Angeles Times. How do their weigh counties with multiple newspapers (and coupon inserts with fewer coupons with the newspapers that are not dominant in the market) like this (and circulation, too)?
LA was the biggest market that didn’t have an easily-accessible total coupon value to include on the map – though I’m sure the total is on the high end.
As for coupons per capita, I believe they include all insert coupons distributed in a county, however they’re distributed – whether in a major newspaper from a nearby city, the local community paper, mailed inserts, inserts wrapped in ads and thrown onto your driveway, etc…
You mean you didn’t believe what the Times Union said about the value of their coupons? 😉 Yes, that has to include things in the ads and such.
I come up with $42.75 in Red Plum and $143.45 for SmartSource or $186.20 Total (possibly a bit more if I cut all the coupons from a page and tossed that, but still $200 or less is a much better amount).
Unfortunately, more of them lately are larger ($1+) which doesn’t help as much with 2 supermarkets who double those under $1.
Wow, nice job doing all the math and coming up with the “real” total! And $186.20 is not a bad total overall – I’d actually be more impressed with seeing that on the cover, than the clearly grossly inflated $3,382 (since, unless you use every single coupon and sales circular in the paper, you’ll never see anywhere remotely close to that amount of savings unless you have tens of thousands of dollars to spend).
Love the additional reporting here, to tease out the actual, relevant learnings from FSI distribution.
I have mad respect for the folks at Kantar / Marx (hi Darcy & Andy!) and the work they do, but overall coupon distribution is indeed a LOUSY way to measure a market’s coupon strength (even without factoring in the per-capita aspect, which can also mislead).
Kantar Media already has and tracks better metrics (namely, overall coupon value and unit value) that can reveal more significant market indicators (highest coupon values = retailer pressure, lousy $0.25 coupons = obligatory participation, etc.) so kudos to CITN for the additional analysis.
There’s all kinds of fascinating stuff to learn about CPG marketing via FSI strategy for those who are inclined… or you could just hire an expert to help you.
Thanks Andrew! Yes, there are a lot of fun things you could do with all the statistics at your disposal – coupons per capita is probably the least interesting metric – but it’s all that Kantar will give up 😉
The Chicago Tribune has awesome coupons every week with higher values. Since I have two stores who give me their leftover papers every Sunday I score big every week!