
Depending on whose statistics you cite – or the types of coupons you tend to clip – coupon values aren’t significantly higher than in years past, and they may even be worse. But by one important measure, a new analysis says they may be a lot better than they seem.
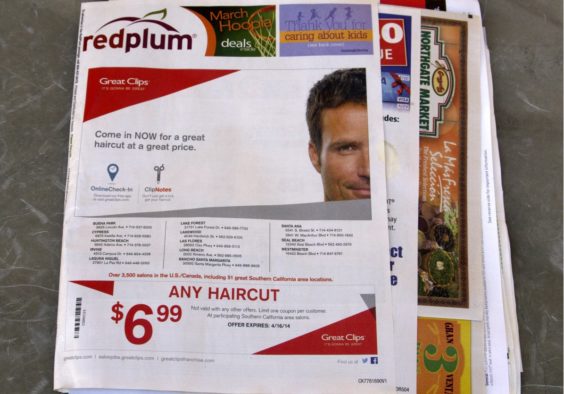
Valassis, the owner of coupon processor NCH Marketing and the publisher of the RedPlum coupon inserts, is out with its own figures about coupon values – and it concludes that we’re saving more money than coupons’ face values might imply.
As a rival to coupon processor Inmar, which released its own coupon analysis earlier this year, NCH produces a rival set of figures based on what it sees from its own clients and the industry as a whole. And while Inmar’s comprehensive, 62-page “Promotion Industry Analysis” presented ample evidence that coupons are not as good as they used to be, Valassis is painting a rosier picture – in a one-page infographic dubbed the “2016 Coupon Savings Report”.
When it comes to coupons’ face values, the two coupon companies differ in their findings. Inmar declared the average coupon value in 2015 to be $1.68, down 2.3% from 2014. Valassis says it was much higher – $1.79, up 4.1% from 2014. Inmar found that the average food coupon value, nonfood coupon value and the total face value of all coupons distributed were all down last year. Valassis found they were up, up and up.
So other than looking at your own food budget year-over-year, or comparing notes with friends, whose figures can you believe when it comes to determining whether using coupons is still as good an investment as it used to be?
You can crunch the numbers in different ways – average face value divided by the number of items you have to purchase, or average face value relative to the price of the product. Valassis chose to compare coupon values to the Consumer Price Index. Valassis reports that the U.S. Department of Labor found that the average price of all consumer goods and services rose a tenth of a percent last year, while coupon values rose 4.1%. The CPI rose 1.6% in 2014, while coupon values rose 6.2%. And roughly the same was true in 2013.
In short, Valassis noted, “marketers have increased coupon face values over the past three years at a pace higher than the Consumer Price Index.”
That led Valassis to conclude that we’re saving more money overall. Regular prices are rising, but coupon values are rising even more.
In total, citing a figure that both Inmar and Valassis seem to agree on, coupon users last year redeemed $3.4 billion worth of coupons. That’s down a couple hundred million dollars from the previous year. But with regular prices also on the rise, you may be saving more money compared to what you might be paying for your groceries, without even realizing it.
“It’s evident that saving continues to be top of mind for shoppers, and coupons are a key factor in planning shopping trips and influencing purchase decisions,” said Wayne Powers, Valassis’ chief revenue and operating officer.
Of course, these are all last year’s numbers. Inmar has already reported that coupon values in the first half of this year are still in decline. And the CPI has been creeping upward. So, unless coupon issuers step up their game, if you feel like you’re spending more and saving less by the time the “2017 Coupon Savings Report” comes out – you may turn out to be right.