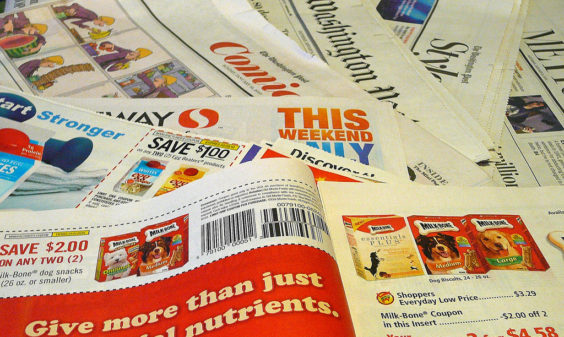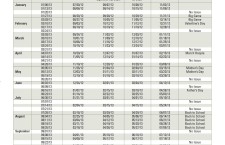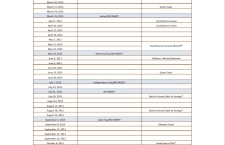
2013 got off to a roaring start, with more coupon inserts than we’d seen in the previous four weeks combined. A sign of good things to come, perhaps? Could be, according to a new report, and the 2013 coupon insert schedules.
According to an annual Kantar Media study, insert coupon distribution is on the rise. More than 274 billion coupons, with a face value of $419 billion, were distributed via inserts in 2012. That’s just about 1% (a mere 2 billion coupons) more than 2011, but it is a reversal of a downward trend. Overall, insert coupon distribution has grown 18% over the past decade.
The exhaustive report has enough facts and figures to make your head spin, but here are some highlights – a bit of “coupon trivia”, if you will:
- Out of 53 Sundays in 2012, coupon inserts were distributed on 48 of them.
- January 29th, 2012, the week before the Super Bowl, had the most insert coupons – an average of 134 pages worth. In 2011, the weekend before Mother’s Day had the most, with an average of 156 pages.
- The average insert coupon value in 2012 was $1.53. The average time til expiration was 7.3 weeks. Both of those figures were down from 2011. While manufacturers are willing to issue more coupons, Kantar Media says, they’re “managing their financial exposure by… decreasing the purchase incentive and shortening the length of time” that coupons are valid.
- Coupons for grocery items took up three-quarters of insert pages, while the rest featured ads or coupons for stores, restaurants, portrait studios and ceramic figurines that you wonder if anyone actually ever buys.
- Walmart was the top advertiser in inserts, followed by Walgreens and Target.
- There were coupons issued for 348 new products last year (check out some of this year’s new products here). New cereals topped the list, followed by snacks and pet food.
- For anyone who’s complained there never seem to be coupons for anything you can actually eat – it appears you’re right. “Snacks” is number four on the list of the top categories of coupons offered in 2012 – and it’s the only edible thing in the top ten (unless you’re a cat or a dog). Personal care products were number one, followed by pet food, household cleaning products, snacks, vitamins, shaving cream/razors, medicine, rug/room deodorizers, hair care and soap.
So what will this year bring? You can check out our weekly look at Sunday’s coupons to see what’s coming up.
And check out the 2013 insert schedules below, as provided by RedPlum and SmartSource, to help plan your newspaper purchases for the rest of the year (click on the thumbnails for larger images). Add in the P&G inserts that generally come out at the beginning or end of most months, and we’re likely to see inserts on 49 out of 52 weeks this year.
See, 2013 is looking even better than 2012 already.


Terrific Post!
Your ‘trivia’ validates some of my (previously) unsubstantiated observations about frequency, product mix, value and expry dates.
I’m going to have to take a look @ that Kantor study. The one where it says that coupon distribution is UP>>>> I was under the impression that newspaper circulation was collapsing????!!!
I need to see how they reconcile these two facts. To me, they’re seemingly counter intuitive.
Perhaps that’s why they chose to stretch out and grab data from the past “decade”. Or the media industry is actually expanding? Or does this include ‘printables’?
Great post-I thoroughly enjoyed it and and will have fun researching further into it. 🙂
Thanks, Barbee. The latest figures show that Sunday newspaper circulation is actually flat – not really collapsing, but not growing either (see https://couponsinthenews.com/2012/11/26/newspapers-are-dying-and-its-all-your-fault/).
This study’s numbers don’t include printables, but they do include all inserts no matter how they’re distributed – via newspapers, direct mail, etc. And of course they include all the ones that end up in the recycling bin from unsold papers and people who toss out their “junk mail”!